- 6 views
Is it really different this time?
There’s a famous line often attributed to Mark Twain – ‘History doesn’t repeat itself, but it often rhymes’.
However, when it comes to the stock markets, history more than rhymes, it almost repeats itself. This is especially true at the peak of bull and bear markets, when the common belief is: ‘this time is different’. Of course, the context keeps changing, but the belief seeps deep into the subconscious mind of investors who usually extrapolate the near term and keep following the momentum.
Over the past few quarters, many investors have started to believe that the Indian economy of today is different from that of the past, resulting in a different composition of various benchmarks. This is feeding into the belief that higher valuation multiples are warranted and a premium to historical averages for various indices is indeed justified.
Let’s look at some of the thoughts that are leading to this belief.
The valuation multiples are being driven by a few very expensive stocks in the indices.
There is a belief that a few very expensive stocks and a few loss-making companies are impacting the indices disproportionately, thereby pushing the PE ratio upwards.
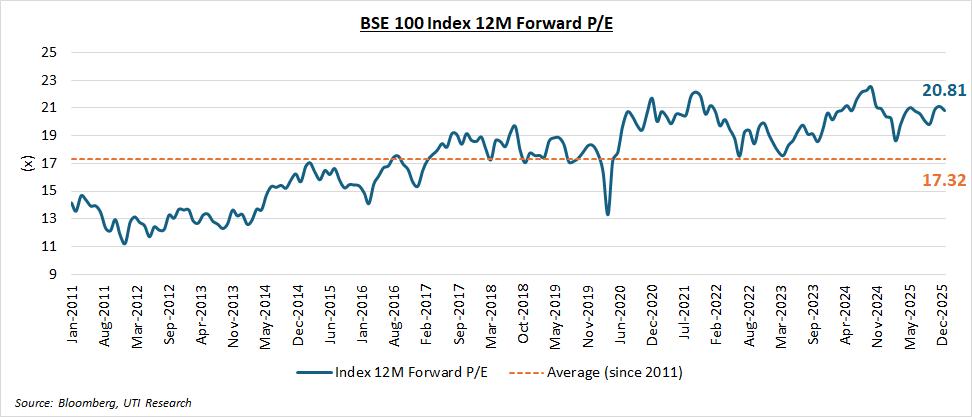
Let us first study the BSE 100 Index.
The 15-year valuation chart for BSE 100 Index is given below. The 12-month forward PE valuations here are unadjusted, with the current valuations at nearly 20% premium over the long-term average.
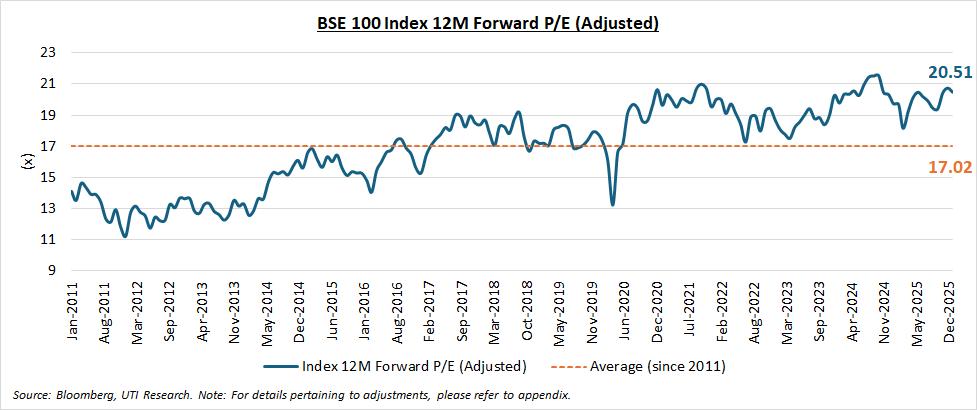
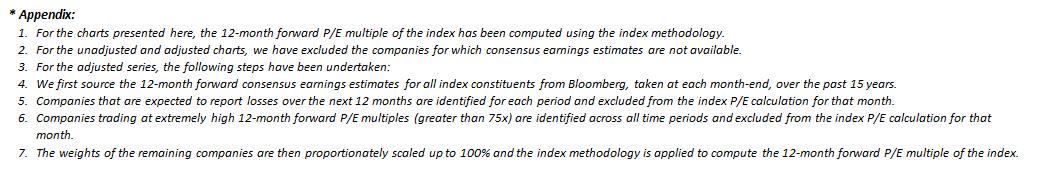
Now, let us adjust the valuation multiples by removing loss-making companies and those trading at a very high 12-month forward PE multiple (more than 75 times). We adjusted the entire series, all the way back to 2011, to create the below valuation chart. The valuations here are only marginally different from the unadjusted valuations, as there are hardly any loss-making companies in the BSE 100 Index, with high PE stocks not having any significant impact. As a result, similar to the unadjusted series, current valuations here are about 20% premium over the long-term average.
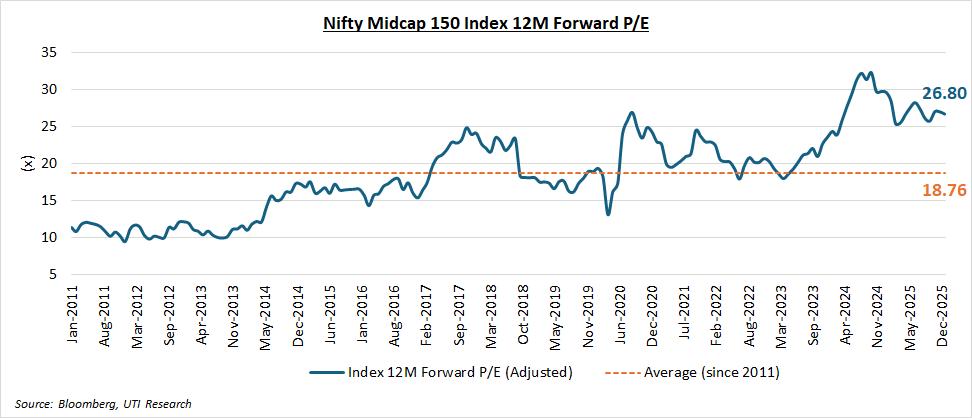
Let us now look at the Nifty Midcap 150 Index.
The 15-year valuation chart for Nifty Midcap 150 is given below. The 12-month forward PE valuations have been unadjusted, with current valuations at around 43% premium over the long-term average.
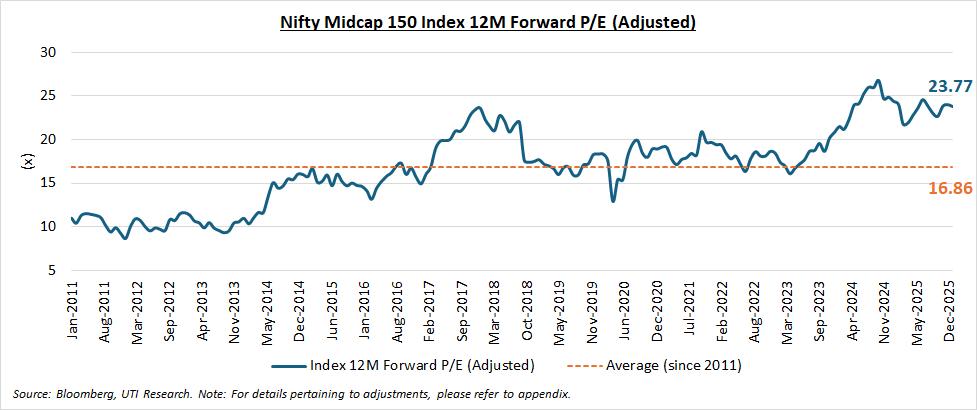
Now, let us adjust the valuation multiples by removing loss-making companies and those trading at a very high 12-month forward PE multiple (more than 75 times). Once again, we have adjusted the entire series, all the way back to 2011, to create the below valuation chart. In this case, we find that the valuations are slightly lower than the unadjusted valuations across the time frame. However, the fact remains that the current valuations are still at around 41% premium over the long-term average of the adjusted series and at ~27% premium over the long-term average of the unadjusted series. Therefore, whichever way the data is sliced, midcaps are trading at a substantial premium to their historic averages.
The sectoral composition has changed materially, which may be causing the valuations to creep up.
There is a belief that as India moved from the old economy towards a new economy, the constitution of the indices changed. The relatively more expensive sectors are now a bigger part of the benchmark, pushing up the valuations.
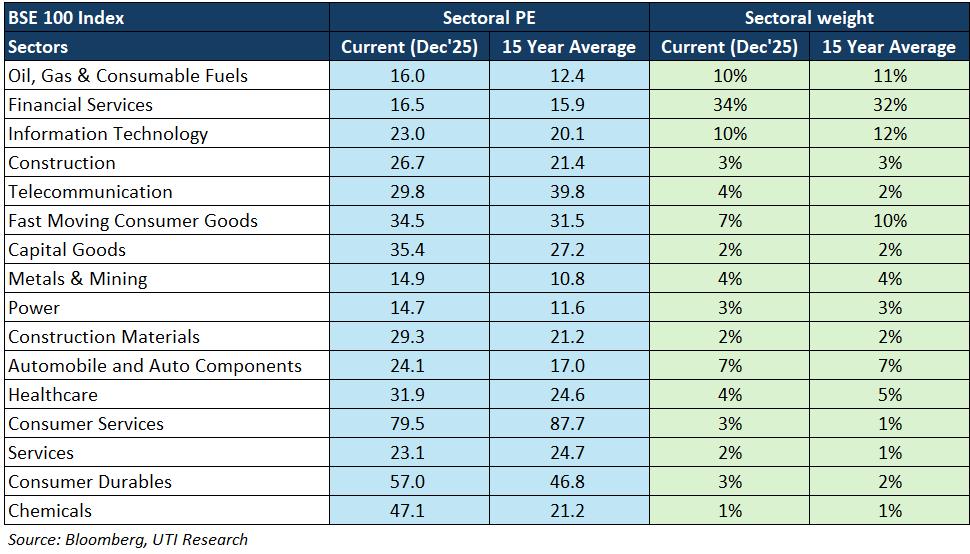
Let us first consider the BSE 100 Index. The following table shows the current PE for each of the sectors versus their respective 15-year average and also the current sectoral weights versus the average weights over the last 15 years.
It is evident that sectoral weights have not moved much over the long-term average, although current valuations for the majority of the sectors have gone up significantly.
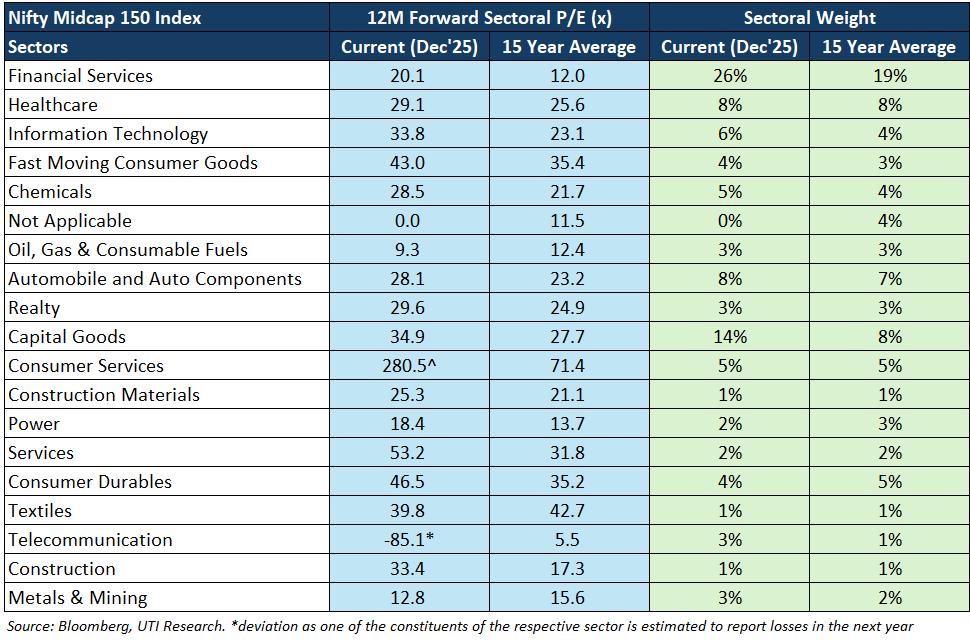
A similar trend can be seen in the Nifty Midcap 150 Index below. While sectoral weights haven’t moved a whole lot, except for a couple of sectors, the sectoral valuations have gone up across the board.
Thus, it can be safely concluded that the real reason behind the increase in valuations for the market as a whole is that most sectors have become expensive.
But hasn’t the growth profile changed for Indian companies?
Although this is another narrative supportive of high valuations, it’s important to consider the facts first. The earnings growth of the broader market has been around 12-13% over the long run. This number is inextricably linked to the nominal GDP growth of the country, which in turn has been in the same ballpark over the past couple of decades. Of course, while nominal GDP growth does not move viciously, earnings growth has its ebbs and flows. It is during times of high earnings growth that investors extrapolate this trend and push the multiples higher, just as during times of weak earnings growth, the multiples get punished since investors become despondent about the earnings potential.
As the size of our economy grows, it is unlikely that the nominal GDP growth will accelerate from the current levels. If anything, as the economy moves from USD 4 trillion towards USD 8 trillion, the nominal GDP growth should start to come down slightly. This may have consequences on the earnings growth as well and it is likely that the earnings growth will come down by a couple of percentage points during this journey. This implies, it is incorrect to hold a hypothesis that earnings in India would accelerate from the existing long-term trend, leading to a higher valuation multiple.
Conclusion: Putting valuations in perspective
The headline PE charts are showing the correct picture of overvaluation.
While investors may believe that index valuations are being distorted by a handful of expensive or loss‑making companies, the evidence clearly shows that such exclusions hardly alter the overall picture. Valuations remain significantly above their long‑term averages across both the BSE 100 and Nifty Midcap 150.
Similarly, the argument that sectoral composition has undergone a structural shift does not hold up to scrutiny. Sector weights have largely remained stable over the past 15 years; what has changed materially is the valuation of nearly every sector, many of which now trade at a substantial premium to history.
Even the narrative of improved long‑term earnings potential offers limited justification for elevated multiples. Earnings growth has historically tracked nominal GDP growth and as India’s economy expands in size, the structural tendency is for nominal growth – and consequently earnings – to moderate rather than accelerate. Therefore, expecting sustainably higher valuation multiples based on an assumption of superior future growth appears inconsistent with empirical evidence.
There could be various narratives used by market participants to justify the prevailing valuation levels, but the long‑term data suggest that markets are indeed trading at rich valuation multiples. In the end, while every cycle has its unique context, history suggests that the essence of market behaviour does not truly change; only our stories about it do.
History also teaches us that markets peak when investors are most confident that “this time is different,” often extrapolating near-term momentum into perpetuity. The data suggest that rather than justifying elevated multiples through structural narratives, investors should carefully evaluate whether current prices adequately compensate for risk, particularly in an environment where valuations have already substantially deviated from historical norms.
The views expressed are author’s own views and not necessarily those of UTI Asset Management Company Limited.
All illustrations/ examples are purely meant for ease of understanding of the concepts and aid in planning by the investor. All illustrations/ examples that depict future values or other estimated numbers are based on reasonable assumptions and in no way give any guarantee or assurance or indication of the future performance. Different types of investments involve varying degrees of risk, and there can be no assurance that the future performance of any specific investment, investment strategy, or product made reference to directly or indirectly in this article, will be suitable for your portfolio. Please note that past performance may or may not be sustained in future and is not a guarantee of any future returns. The reader is urged to consult his or her financial advisor before making any investment decisions.
UTI Asset Management Company Limited (UTI AMC) or UTI Mutual Funds (UTI MF) along with its affiliates assumes no obligation to update or otherwise revise these estimates.
Mutual Fund investments are subject to market risks, read all scheme related documents carefully.


Ajay Tyagi is Head of Equities at UTI Asset Management. He is a CFA Charter holder from The CFA Institute, USA and also holds a Masters degree in Finance from Delhi University. Ajay joined UTI in the year 2000 and has successfully carried out various roles and responsibilities across equity research, offshore funds as well as domestic onshore funds. He has won many awards and accolades for his performance both domestically and globally. Ajay presently manages our flagship equity scheme in India and is also the Investment Advisor to UTI International’s range of India dedicated offshore funds.