- 1 view
“Are we in an AI bubble and, if so, what impact could it have on global equity markets?”
This remains the most commonly asked question among investors today. While it is always difficult to predict cycles, one can still hold an informed view of where we stand in the current cycle. Most parallels are being drawn to the dot-com crash of the early 2000s and the years leading up to it.
The US equity market is not yet in a classic, market-wide bubble, but it is in a bubble-prone AI capital-expenditure supercycle. The current rally has far stronger earnings support than the dot-com bubble, but valuations, market concentration, narrative dominance and capex extrapolation have moved into zones where forward returns increasingly depend on flawless execution by a small number of mega-cap companies.
To understand the dynamics of AI capex, comparisons with previous tech cycles are warranted. If one looks at the current AI capex, the pace bears significant similarities to the internet era of the late 1990s. The internet boom, too, began with a buildout phase (1997–98), when hardware infrastructure was being laid out, while the technology itself remained nascent, with limited use cases and a high cost structure. Eventually, as is typical of most cycles, excesses built up along the way, leading to stretched balance sheets and poor incremental RoICs (Return on Invested Capital).
The AI capex cycle is the dominant capital allocation story of the current era. The largest public hyperscalers accounted for approximately $400 billion in capital expenditure in 2025, nearly 70% higher than in 2024. Forecasts for 2026 are even more aggressive, with consensus estimates pointing to around $500 billion in capex for the hyperscaler group, representing 34.6% of total S&P 500 capital spending (Source: Bloomberg).
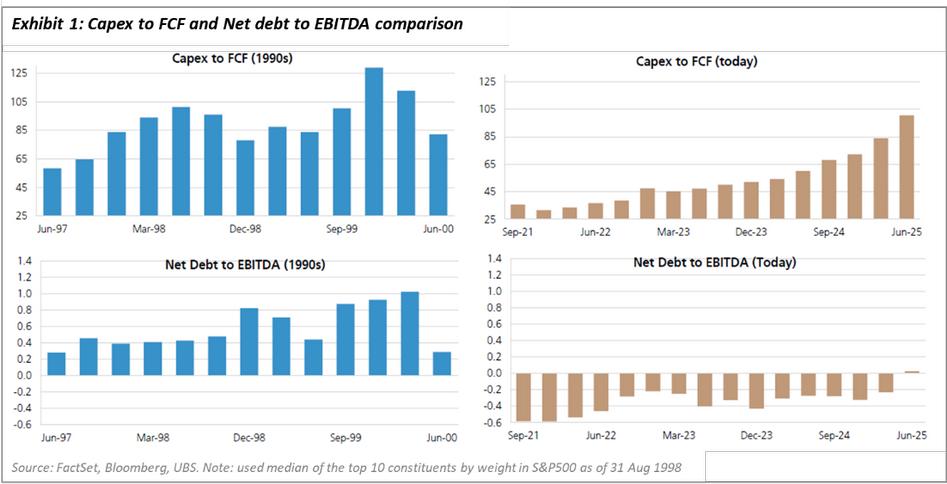
Putting this in historical context, as shown in Exhibit 1, AI capex has already reached the intensity that we witnessed in the late 1990s, when capex at a similar scale preceded a significant impairment of returns. In the previous cycle, the capex-to-FCF ratio averaged about 85% in the three years leading up to the eventual meltdown in early 2000. This time around, the ratio remained significantly lower over the past few years but has now crossed 100% for the last few quarters, signaling a sharp increase in capex intensity.
The key difference from 1999 is that today's hyperscalers are generating real cash flows, and the infrastructure buildout—at least so far—has been funded by operating earnings rather than any speculative capital markets financing.
The core debate is not whether AI will matter, but whether the $500+ billion in annual infrastructure spending will generate returns that justify current market valuations. A survey of over 6,000 executives conducted by Goldman Sachs found that more than 80% of companies reported no measurable productivity gains from AI, despite billions in investment. McKinsey & Company’s 2025 State of AI survey found that only around 6% of respondents qualified as “AI high performers”, achieving a 5%+ EBIT impact. JPMorgan estimated in November 2025 that AI would need to generate over $600 billion in annual revenue just to achieve a 10% return on infrastructure investment.
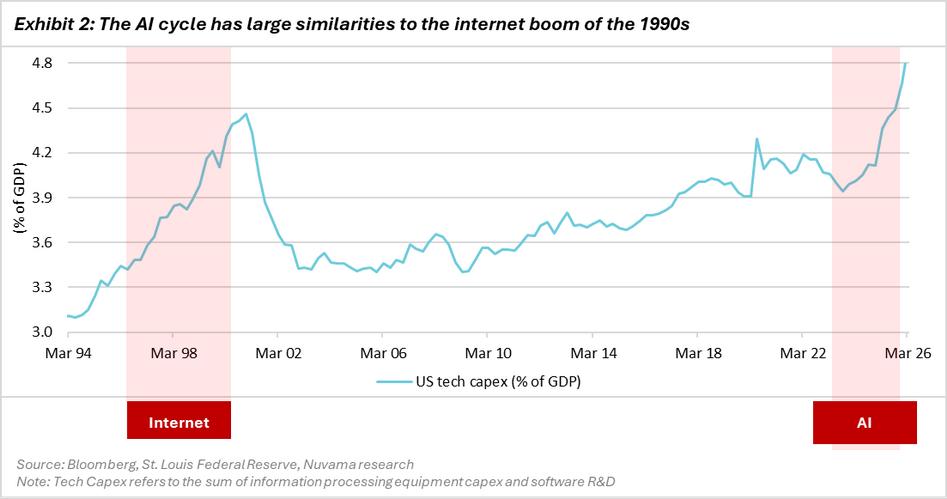
This is not an easy feat, as the asset base being built implies a revenue hurdle that has not yet been demonstrated at scale. Exhibit 2 shows US tech capex as a percentage of GDP over the last 30 years. Current capex intensity has already surpassed levels witnessed during the tech bubble.
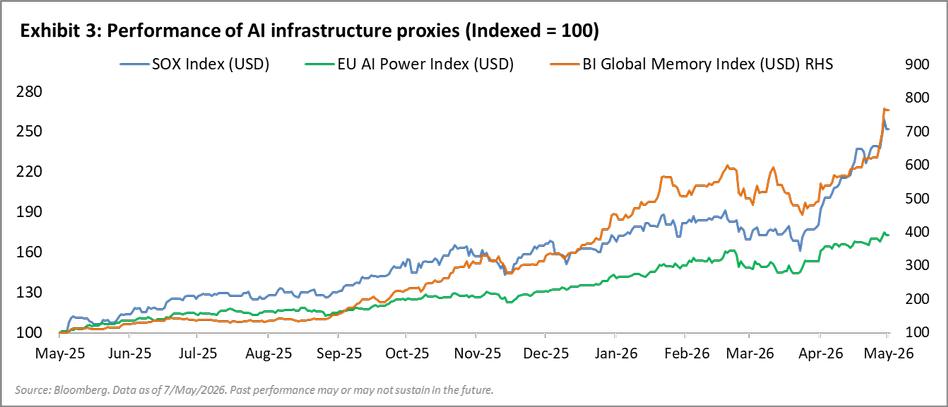
Apart from the investment binge underway, the excitement around AI is also being reflected in the stock markets (as shown in Exhibit 3). If you look at the Philadelphia Semiconductor Index (SOX)—an index comprising companies involved in the design, distribution, manufacturing and sale of semiconductors—the euphoria is evident. The index has more than doubled in the last year alone.
Similarly, the EU AI Power Index, which consists of EU listed stocks and is designed to measure the performance of AI Infrastructure companies, is up by almost 75% in the last year.
Finally, the Bloomberg Global Memories Index, an index of memory companies, has gone up by almost 8 times over the last year.
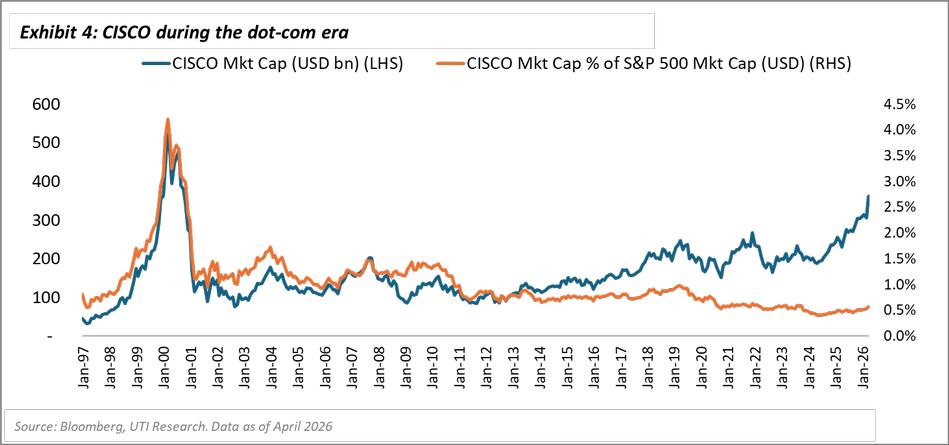
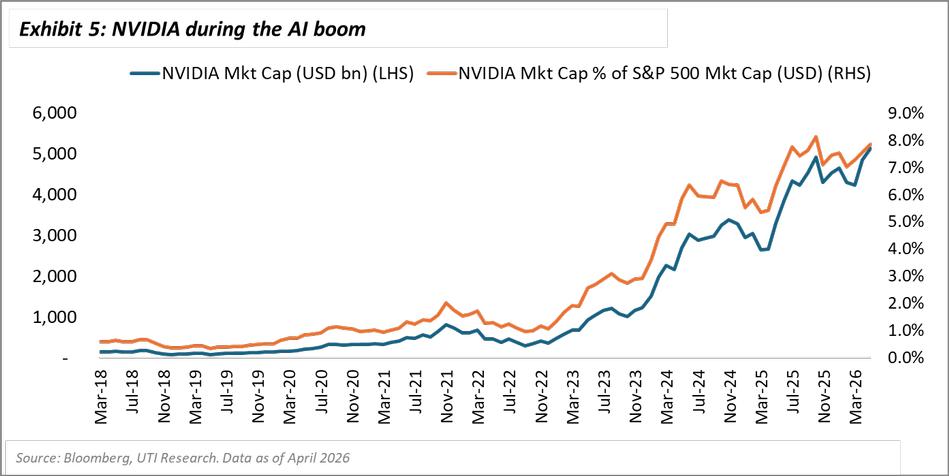
During the dot-com era, investor excitement towards hardware companies was similarly extreme. The key hardware player at the time was CISCO, which supplied routers and modems to sustain the internet boom, similar to what NVIDIA is today for the AI boom. CISCO’s revenue and free cashflows increased multifold during the adoption phase, once again mirroring what NVIDIA is witnessing today.
As a result, CISCO’s market cap reached 4% of the S&P 500’s total market cap (as shown in Exhibit 4) before correcting sharply. Even after more than a quarter of a century, the stock remains below its all-time highs. For context, NVIDIA’s current market cap already exceeds 7% of the S&P 500 market cap (as shown in Exhibit 5).
In conclusion, while history does not repeat itself, it certainly rhymes. Although every technology cycle has different utility and adoption curves, markets do seem to be getting ahead of themselves in expecting AI to deliver meaningful productivity gains and, consequently, improved profitability for businesses. Looking at the data above, it appears that we may already be in the late stages of the cycle. A peaking of AI capex amid tariff wars and energy-related pressures could lead to heightened volatility and uncertainty in global markets.
Stocks referred are illustrative and should not be construed as investment advice or a research report or a recommendation to buy or sell these stocks by UTI Mutual Fund/ AMC. Recipients are advised to conduct their own independent assessment of the information and obtain appropriate financial, legal, tax, or other professional advice before making any investment decisions.
The views expressed are the author’s own views and not necessarily those of UTI Asset Management Company Limited. The views are not investment advice and investors should obtain their own independent advice before taking a decision to invest in any asset class or instrument.
Mutual Fund investments are subject to market risks, read all scheme related documents carefully.


Ajay Tyagi is Head of Equities at UTI Asset Management. He is a CFA Charter holder from The CFA Institute, USA and also holds a Masters degree in Finance from Delhi University. Ajay joined UTI in the year 2000 and has successfully carried out various roles and responsibilities across equity research, offshore funds as well as domestic onshore funds. He has won many awards and accolades for his performance both domestically and globally. Ajay presently manages our flagship equity scheme in India and is also the Investment Advisor to UTI International’s range of India dedicated offshore funds.