On July 31, 2020, the Nifty Pharma index has hit a 52-week high levels. This no doubt gives us great satisfaction considering that the Pharmaceutical sector is the largest overweight sector position in UTI Value Opportunities Fund (the Fund). Even as many of our portfolio companies were battered by the impact of the COVID-19 pandemic, this index has bounced nearly 79% from its low in Mar-2020. As of July 31, 2020 the fund’s exposure to the Pharmaceutical sector is 11.26% and the fund is overweight by nearly 5.40%. to the benchmark (Nifty 500 index). It’s nice when such things happen and nice to be complimented for this outcome. But, the purpose of this article is not to tell you how prescient we are.
Those who know/tracked the data would be aware that the Nifty Pharma index was at a 52-week low on March 13, 2020. In fact, at its low in March this year the Nifty Pharma index was at a price level it had last traded at in Apr-2013; seven years of going nowhere. At the low point in Mar-2020 the index was down by over 55% from the high it had recorded in Apr-2015. Wish we could tell you that we bought pharmaceutical stocks by the barrel at the bottom. But unfortunately, the story is a lot more boring.
The pharma sector had caught our attention in 2018 and by Dec-2018 it was an overweight position.
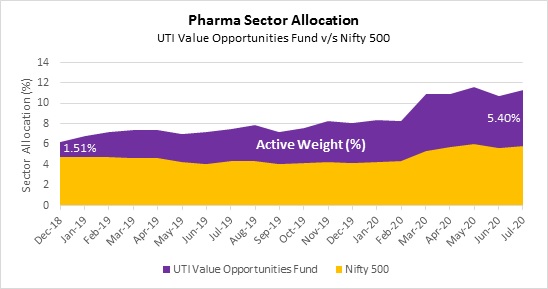
Active weight - UTI Value Opportunities Fund vis-à-vis benchmark index (Nifty 500)
In Dec-2018 the fund’s exposure in the pharma sector was only slightly higher than the industry average as you can see in the chart below. However, as the sector underperformed, we continued to add and this is too reflected in the chart below, where our exposure climbed even as the sector exposure of the MF Industry declined.
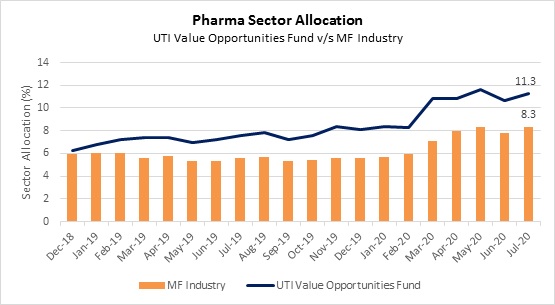
Source: MOFSL. MF Industry represents equity exposure in Pharma/Healthcare sector for all mutual fund schemes (including balanced and other schemes).
The sector stood out as cheap based on two of the screens, we looked at to screen for intrinsic value – Price to Book (P/B) and Price to Sales (P/S). Further, Free Cash Flow yield was edging up for many of the companies we owned. Therefore, we kept adding to the position in the fund throughout 2019 as you can see below. Our exposure climbed even as prices stayed flat or dropped.
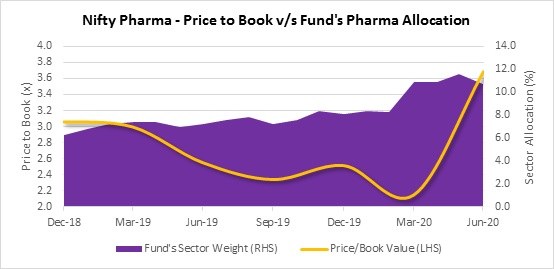
Source: Bloomberg, 12-month trailing P/B ratio
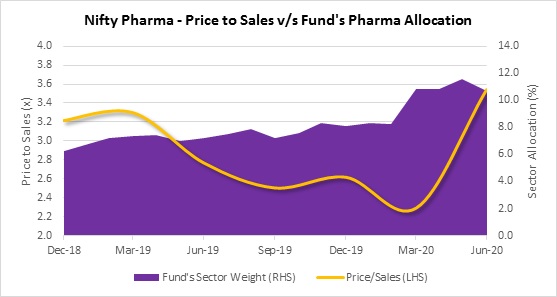
Source: Bloomberg, 3-month ending P/S ratio
And we also wrote about the fund’s stance on its exposure to pharma sector every quarter as you can see in the table below:
|
Month |
Fund's Weight (%) |
Active Weight (%) |
Quarterly Commentary |
|
Dec-18 |
6.24 |
1.51 |
The fund has increased the overweight position in Pharma as valuations had turned reasonable. Our preference is for companies that have strong domestic market exposure. |
|
Mar-19 |
7.39 |
2.74 |
The Fund has increased the overweight position in Pharma as valuations are attractive. Continue to remain positive on growth and profitability in the domestic market and at current valuations we think the concerns over US generics exposure are adequately reflected in the stock price. |
|
Jun-19 |
7.19 |
3.10 |
The Fund has increased the overweight position in Pharma as valuations are below long term average. Continue to remain positive on growth and profitability in the domestic market and concerns over US generics exposure are adequately reflected in the stocks price. |
|
Sep-19 |
7.19 |
3.10 |
The Fund has increased the overweight position in Pharma as valuations are below long term average. Continue to remain positive on growth and profitability in the domestic market and concerns over US generics exposure are adequately reflected in the stocks price. |
|
Dec-19 |
8.10 |
3.95 |
The Fund has increased the overweight position in Pharma as valuations are below long term average. Continue to remain positive on growth and profitability in the domestic market and concerns over US generics exposure are adequately reflected in the stocks price. |
|
Mar-20 |
10.87 |
5.56 |
The Fund has maintained large overweight position in Pharma as valuations are still broadly below long term average. Continue to remain positive on growth and profitability in the domestic market and concerns over US generics exposure are adequately reflected in the valuations. |
|
Jun-20 |
10.69 |
5.10 |
The Fund has maintained large overweight position in Pharma, valuations are now broadly in-line with long-term averages. Continue to remain positive on growth and profitability in the domestic market and focus will shift to growth in US market from new product launches. |
Active weight vis-à-vis Benchmark index (Nifty 500)
We were following our process and buying more even as the market was telling us that we were wrong by driving prices lower. This is the underpinning of our process, but it can be rather painful. The sector underperformed the fund’s benchmark (Nifty 500) consistently even as we continued to add to our positions as you can see in the chart below. As we entered Feb-2020 the underperformance was rather painful.
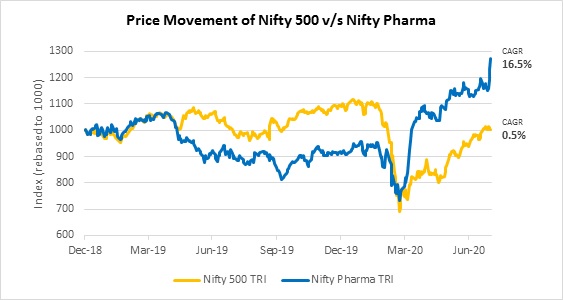
Source: Bloomberg. Point-to-point returns from 31/12/2018 to 31/07/2020 CAGR – Compound Annual Growth Rate
We had no idea in Feb-2020 that our fortunes were about to change in the days ahead. The sector dropped along with the market in the early part of Mar-2020 but then something changed, and the sector suddenly exploded upside in Apr-2020. Did COVID-19 cause pharmaceutical stocks to do better? We don’t have an answer to that question. The market does not speak and so we can only surmise as to the reasons. Truth be told we don’t see COVID-19 as a driver of growth in the sector in a meaningful manner. Our investment case was driven the arguments we made in our monthly commentary.
This push higher through Jul-2020 has now made this position a rewarding position for the fund. Our experience here is typical of our experience with buying value. We know that when we are drawn to value it is often a painful trade to begin with. Let me add - It can be a long and painful wait. We have no special skill at timing, but we do subscribe to the belief that value is eventually recognized by the market.
At the end of Feb-2020, the fund’s 1-year performance attribution table had this entry (placed below) for the Pharmaceutical sector. Being overweight the sector was not working and neither was our stock selection. It was one of the fund’s largest negative attribution positions for the 1-year ended Feb-2020.
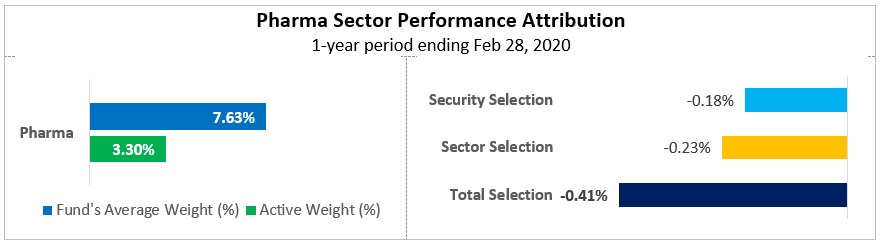
Performance attribution vis-à-vis Benchmark index (Nifty 500)
Then this happened in the 5 months from Feb-2020 to Jul-2020. Pharmaceutical was the single largest positive contributor at sector level to the fund.
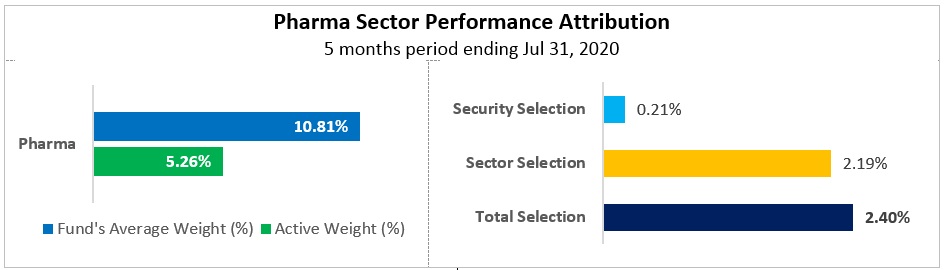
Performance attribution vis-à-vis Benchmark index (Nifty 500)
Furthermore, even for the period since Dec-2018 to Jul-2020, Pharmaceutical stood as single largest positive contributor at sector level to the fund.
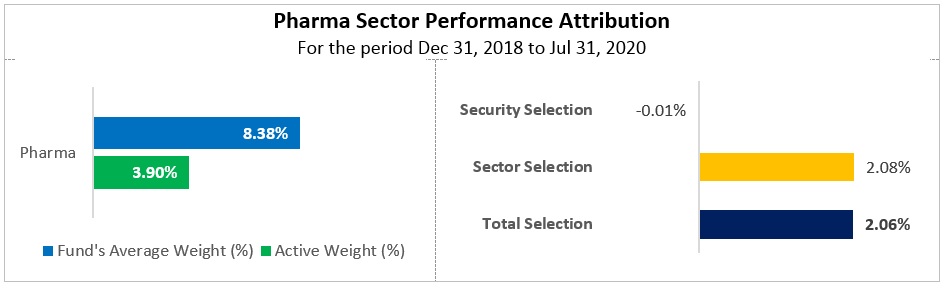
Performance attribution vis-à-vis Benchmark index (Nifty 500)
In sharing this story with you we wish to draw your attention to our adherence to process - that includes how we pick stocks, sectors and use cheap valuations in ‘out favor sectors’ to our advantage. It is a lonely place because very rarely does the market agree with us when we start to scent value. In fact, in my experience stocks do rather poorly in the early period when we are drawn in by value.
Managing a value strategy requires us to be willing to go into unpopular areas, stick by our beliefs which are driven by intrinsic value even when the prices tells us that we are wrong.
Through this period, we had to manage risk; including position size judiciously. Last but not the least, we must continuously revisit our investment hypothesis. That’s one reason why we own a basket of pharmaceutical stocks. The idiosyncratic company specific risks especially plant related FDA issues have been a pain point. As a comparison, in the Information Technology sector, we own 13.44% across just 4 names whereas our relatively smaller exposure of 11.26% in Pharma is split across 6 names, as of July 31, 2020.
We write this piece only to highlight how process, mandate (value) and patience combine to help us deliver what we hope will be superior outcomes versus the benchmark i.e. Alpha. This is not a recommendation for a sector. We do not have a magic wand that tells us when to buy or sell sectors, but valuations provide us with a framework. This is a description of how our process works. It can and often is boring. There is no ‘Eureka’ moment in our process.
Annexure
At the end of Jul-2020, performance attribution for the Pharmaceutical sector even in the fund’s 1-year period was one among the largest contributor at the sector level to the fund.
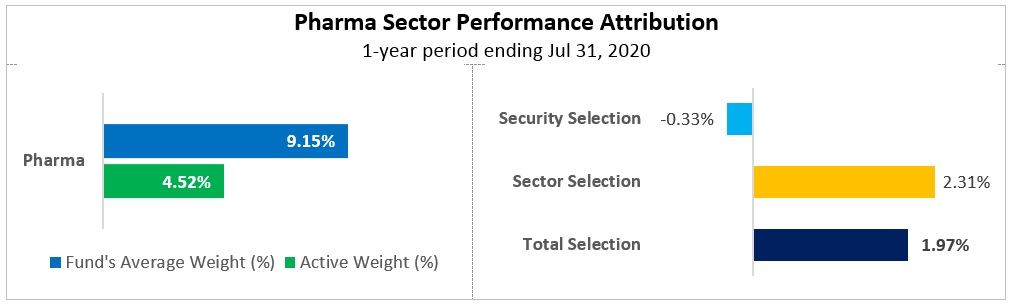
Performance attribution vis-à-vis Benchmark index (Nifty 500)
Product Label

* Investors should consult their financial advisers if in doubt about whether the product is suitable for them
MUTUAL FUND INVESTMENTS ARE SUBJECT TO MARKET RISKS, READ ALL SCHEME RELATED DOCUMENTS CAREFULLY.