A good corporate encourages diversity in gender, culture, ethnicity, experience and educational qualification. Diversity at work ensures a professional environment that encourages better idea generation, productivity gains and customer centricity.
At UTI Mutual Fund, in addition to diversity in work culture, we also believe in diversity in investment styles. This allows investors the opportunity to choose from a variety of products, which are managed either with a pure growth style or with a pure value style or with a blend of growth and value. This ‘diversity of styles’ is what differentiates us in an otherwise standard product category that is allowed by the regulator. This enables investors to diversify their investments by investing in different investment styles.
In this article we will elaborate on ‘Dividend Yield Investing’, which UTI follows while selecting investment ideas from the universe of high dividend yielding companies. UTI’s Dividend Yield Fund uses the dividend yield as the basic filter and analyses other fundamental factors to ascertain the intrinsic value and the possibility of capital appreciation, while constructing the portfolio.
Score Alpha helps in finding winning investment options
Before moving to Dividend Yield Investing, it may be worthwhile to recap our proprietary investment process "Score Alpha".
UTI’s Score Alpha provides a rigorous and pragmatic approach to equity investing across investment styles and market capitalisation. Return - the outcome earned in the future - is uncertain. Score Alpha helps us to stay invested in our convictions; it gives equal importance to avoiding potential mistakes and to finding winning businesses.
We assess the intrinsic value of companies by building reasonable future expectations, considering the past reported fundamental parameters and earnings trends. The two main pillars of Score Alpha are consistency of operating cash flow generation and the quantum of Return on Capital Employed/ Return on Assets.
We have observed a high level of persistency in the ratings* that we assign to companies in our coverage, i.e., most companies retain their ratings even after five years.
*As a part of the investment process, companies are rated based on two most important parameters: Consistency of Operating Cash Flows (OCF) and Return on Capital Employed (RoCE)/ Implied Return on Equity (RoE). The 3-tier rating process assigns C1/C2/C3 rating (for other than financial companies) for OCF consistency - C1 being the most consistent positive OCF generation i.e., every year for the last five years. R1/ R2/ R3 is based on the previous five-year average return on capital (for manufacturing companies and non-lending non-banking finance companies (NBFCs). The rating is based on the previous five-year average return on asset for banks and NBFCs (including housing finance companies).
Total return is more important than the dividend alone
UTI Dividend Yield Fund follows the Growth At Reasonable Yield Style (GARY).
Dividend yield of a company, which is calculated as the last 12-month dividend divided by the current market price, is generally a small portion of the total return from a company. For example, Company A quotes at Rs.100/share on April 1, 2021, and pays a dividend of Rs.2/ share and reaches Rs.120/ share by the end of the year. The return generated by Company A for the shareholder is 22%, meaning 2% by dividend and 20% on account of the capital appreciation.
Of course, there will be companies like - utility companies with matured growth - that will have high dividend yield of 8-10% and the large part of the return from such companies may come from dividend.
There may also be companies that have high dividend yield as well as potential for high capital appreciation, particularly when valuations are very attractive. For e.g., IT services companies in 2017 had dividend yield of 4-5% quoting at historically low P/E ratios of 10-20 times. The total CAGR return generated by most of them over the last five years (ended August 17, 2022) ranged from 20% to 53% vs 15% by NIFTY 500 TRI.
Thus, it is important to evaluate companies based on their ability to generate capital appreciation and sustenance of dividend.
Analysis of Nifty 500 constituents
Keeping the above data in mind, we analysed the Nifty 500 constituents over the last five years. A total of 402 companies have listing history for at least five years. The point-to-point Compounded Annual Growth Return (CAGR) for NIFTY 500 TRI was 13.5% for the five-year period, ending August 17, 2022. Companies with five-year average dividend yield of >1.4% (classified as High Dividend Yield (HDY)) posted average return of 15%, outperforming the Nifty 500 TRI as well as Low Dividend Yield companies i.e., companies with 1.4% or lower dividend yield. (Refer Table 1).
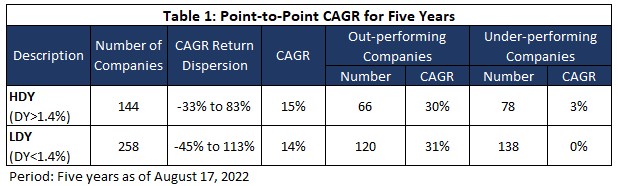
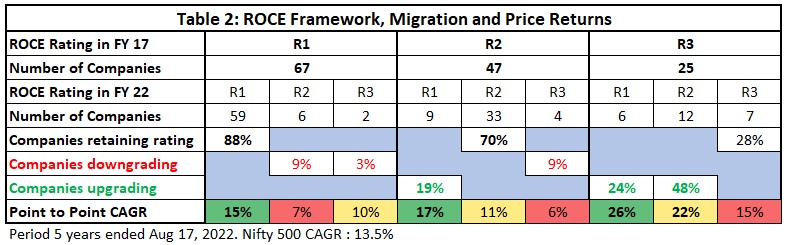
The universe of HDY companies depicted similar observations on rating persistency, relationship of rating migration and price returns of companies in our entire universe of over 350 companies. (Refer Table 2).
Of the 67 companies that were rated R1 in FY17, 88% retained the R1 rating in FY22. This signified that most businesses continued to post high ROCE /ROA and generated average return of 15%, generating 1.5% CAGR above Nifty 500 TRI. However, there were a few R1 companies that migrated to R2 and R3 rating. These 8 companies underperformed by a wide margin. On the other hand, 9 out of 47 companies with R2 rating in FY17 saw upward migration to R1 and posted better returns. In fact, R3 Companies of FY17, which improved rating to R1 and R2, posted higher returns at 26% and 22% respectively. Some of the metal and power utility companies saw rating improvements from R3 to R2, where UTI Dividend Yield Fund also had exposure.
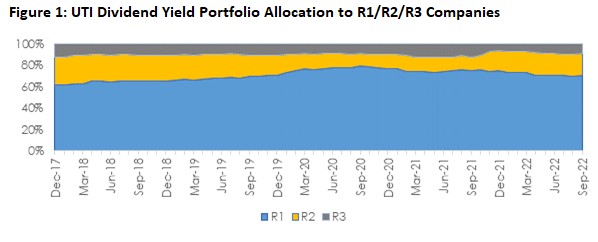
UTI Dividend Yield Fund, thus, has maintained predominant share in R1 companies along with exposure to R2 /R3 companies, where we believe that with improving fundamentals the capital appreciation potential could also be higher. (Refer Figure 1).
Importance of consistent operating cash flows
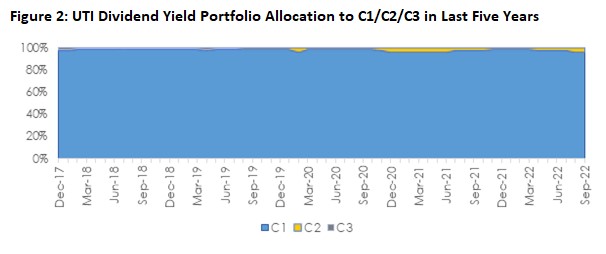
Cash flow is to business what oxygen is to humans. Scarcity of it leads to destabilisation. For example, companies with inconsistent cash flow generation might have to borrow to meet commitments and future expansion. Too much of borrowings can worsen the capital structure, impairing companies’ ability to raise incremental capital either through debt or equity. Hence, a consistent cashflow generation is a desired quality or hygiene factor that equity investors look for before investing. UTI Dividend Yield’s portfolio has consistently been invested > 95% in C1 companies.
Higher free cash flow yield is comforting
In addition to the consistency of operating cash flows, cash flows after capex i.e., Free Cash Flows are important for dividend yielding investors. Businesses, which generate free cashflows consistently, are in a position to share them with the shareholders through dividend pay-outs regularly. Thus, current Free Cash Flow Yield (FCF Yield) is as important as current dividend yield. A higher FCF Yield than the Dividend Yield provides comfort on company’s ability to continue dividend distribution, at least in the near term.
Earnings growth preference
Higher absolute profit means higher absolute dividend, even if the dividend pay-out ratio remains the same and higher capital appreciation assuming the valuation remains the same. In fact, we have experienced high growth in earnings rerates valuation multiples. For example, IT stocks had seen expansion of PE multiples from 10-20 times to 15-30 times between 2017 and 2021, as the earnings growth surprised positively.
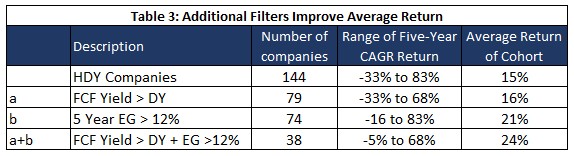
It would be interesting to see whether these additional filters on Free Cash Flow (FCF) Yield and Earnings Growth can improve the return performance of companies out of 144 HDY universe.
As can be seen in Table 3, the average returns increased from 15% to 24% when both FCF yield and Earnings Growth (EG) filters were applied. Interestingly, the dispersion of the returns also improved.
However, the above analysis has hindsight bias, since we have analysed the FCF Yield, Dividend Yield and actual reported five-years earnings growth, ex post. The following examples give insights into why we preferred overweight exposure in IT sector vs Energy sector in FY 2017. Both these sectors, back then, had companies with high dividend yield and cheap valuations.
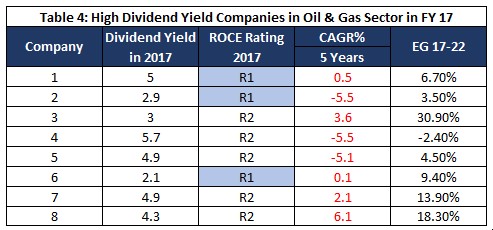
Oil and Gas Sector companies with high dividend yield in FY 17 are listed in Table 4 below. Most of these companies had inconsistent Free Cash Flow generation in the past, and the capital allocation decisions may not have been fully aligned with the interest of minority shareholders. Only three out of 8 companies had R1 rating.
In addition to the crude and gas price volatility in this Global Cyclical sector, the companies’ inability to respond - by repricing their products - made it challenging for investors to estimate growth. Also, muted volume or production growth and doubts on the terminal growth in the face of EV disruption were a few data points to justify that the cheap valuations were not attractive then. What followed, during the subsequent five years, was low earnings growth and underperformance by all 8 high dividend yielding companies in the sector, as reflected in negative to single digit CAGR over five years.
Following is the contrasting case of the IT sector’s high dividend yielding companies. (Refer Table 5).
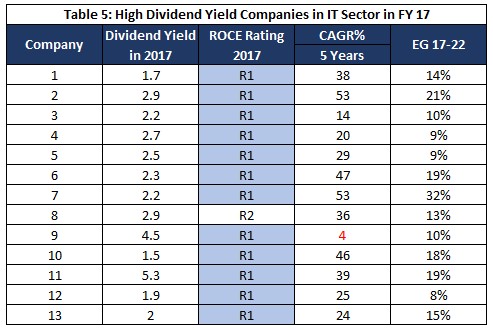
Except for one R2 company, all were high ROCE generating companies. The valuations were at historic low levels due to near-term revenue growth concerns. The free cash generation was highly consistent in this service industry (low capex intensity), giving us comfort of its sustainability. By and large, the stable EBITDA margins of the past reflected clear profitability focus. While we could not have predicted the extent of rerating of the sector if growth returned, we took an overweight stance based on the fundamental positives described above.
All High Dividend Yielding IT companies except one IT Product company, outperformed Nifty 500 by a wide margin. In fact, mid cap IT companies outpaced large cap companies on earnings growth and on the extent of outperformance.
Conclusion
To conclude, dividend yield investing with Growth at Reasonable Yield (GARY) style uses both the current dividend yield and the potential earnings growth, while constructing the portfolio. Consistency of Operating Cash Flows, higher Free Cash Flow Yield (than the dividend yield) and growing earnings provide the fundamental basis of expecting the sustenance of the dividends and the potential of capital appreciation without building any expectation of re-rating in valuation.
Common Source: Company Reports, Bloomberg, UTI Research
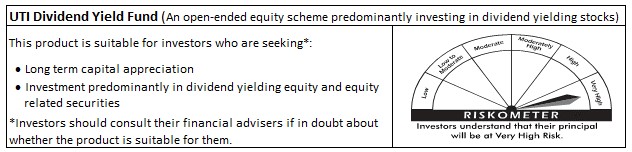
Risk-o-meter for the fund is based on the portfolio ending September 30, 2022. The Risk-o-meter of the fund/s is/are evaluated on monthly basis and any changes to Risk-o-meter are disclosed vide addendum on monthly basis, to view the latest addendum on Risk-o-meter, please visit addenda section on https://www.utimf.com/forms-and-downloads/
Mutual Fund Investments are subject to market risks, read all scheme related documents carefully.