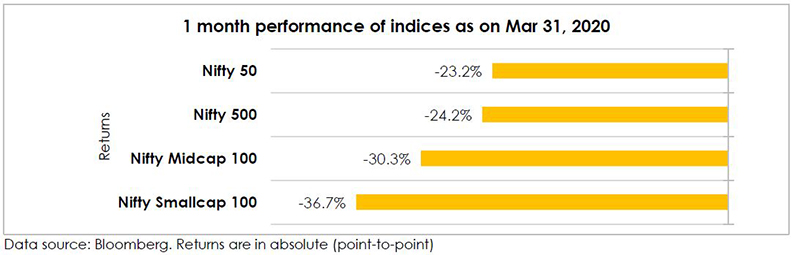
March 2020 was one of the worst months for equity market. Indian indices witnessed massive sell-off in line with global equities sparked by the COVID-19 pandemic and potential economic damage amid lock-down worldwide. Large cap based index, Nifty 50 dropped by over 23% and broad-based index, Nifty 500 fell by a little over 24%. Mid cap and Small cap benchmarks vis., Nifty Midcap 100 index fell over 30% and Nifty Smallcap 100 index dropped by over 36%.
There is much discussion about pandemic proof strategies these days but ironically all the discussions have happened after the event. The term pandemic was not in our vocabulary prior to February 2020. Crises and market falls are part and parcel of the investing journey. Just over a decade ago, we had the Global financial crisis (2008-09); it was the first event of its kind for many investors. In the late nineties, we had the Asian crisis followed by the technology meltdown of 2000. We are still working our way out of this crisis and hopefully we will not encounter a pandemic again. But you can be sure that in the future there will once again be an unexpected event - the first of its kind. That’s just the way the world works.
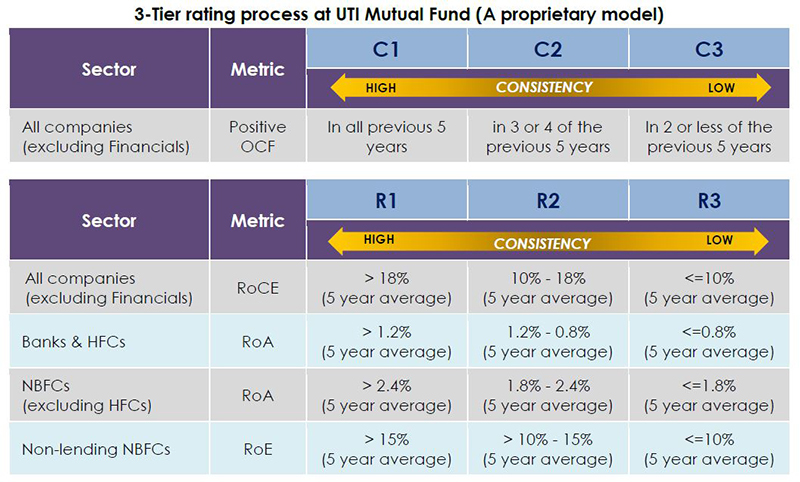
What lessons can we learn from the brutal fall in stock prices in March 2020? With that in mind we decided to explore the anatomy of the bear in March 2020. And we used the two pillars of our investing process – Return on Equity (RoE), Return on Capital Employed (RoCE), Return on Assets (RoAs) for Financial companies and Operating Cash Flow (OCF) to see if it offered any patterns.
As a reminder, this is how companies are given a rating based on RoE / RoCE/ RoA & OCF
In the data below, we have analyzed stocks in Nifty 500 index based on stock price movements; this data is not weighted by market cap, therefore you will find that the average fall in stock prices of companies in Nifty 500 was 29.6% vs the fall in the index (free float market cap) of 24.2% in the month of March 2020.
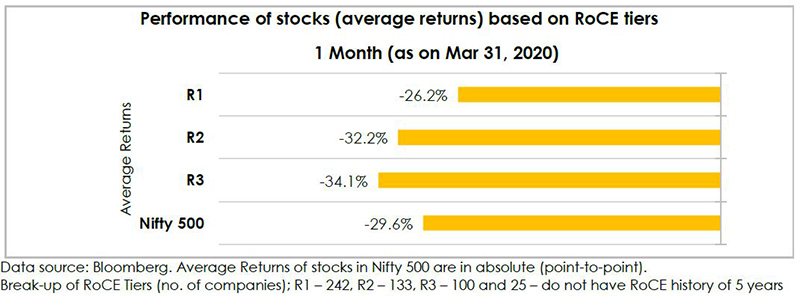
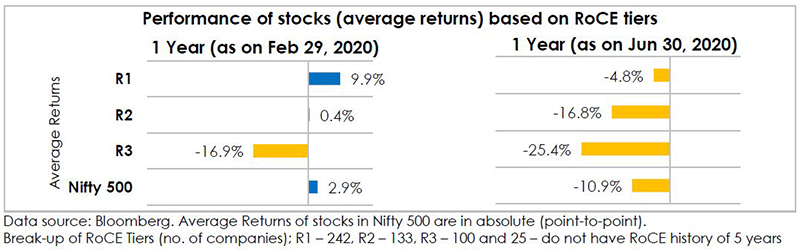
As compared to the average fall of 29.6% for stocks in the index, stocks rated R1 dropped on average by 26.2%. R2 rated companies dropped on average by 32.2% and R3 rated companies on average by 34.1%
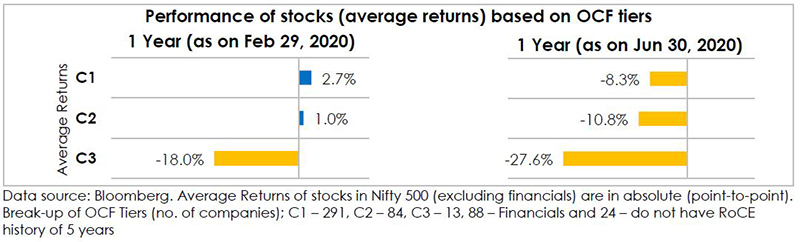
Now let’s look at how companies fared by based on their operating cash flow rating. This rating is done only for companies, Excluding companies in the financial sector.
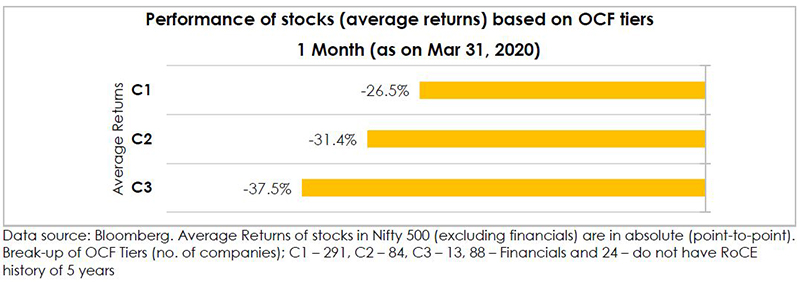
The average fall in month of March 2020 for C1 rated companies was 26.5% vs 31.4% for C2 rated companies and 37.5% for C3 rated companies. As we have often said companies that don’t generate OCF depend on the benevolence of their shareholders and mercy of their bankers. And this makes them vulnerable.
This anatomy of the bear confirms our underlying beliefs that companies that generate consistent OCF and earn a healthy return on capital over the business cycle are better placed when a crisis hits.
Now of course we are in the process of reopening the economy. In other words, businesses are gradually re-opening, supply chains are getting activated and customers are buying again. The government and RBI have intervened, and optimism is creeping in again and replacing pessimism.
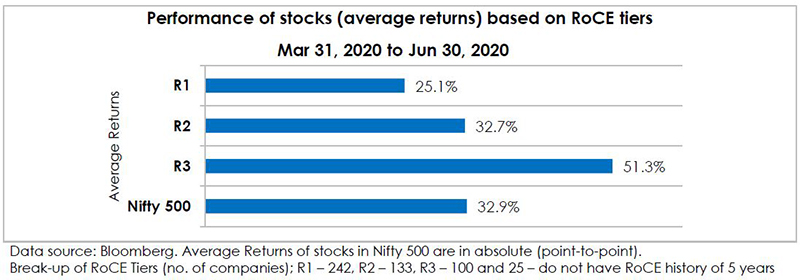
What we see now is a reversal of trend - the R2 and R3 companies are faring better (post COVID-19 meltdown period), as things get less bad. What matters is not whether the situation is good or bad but whether it’s getting better or worse.
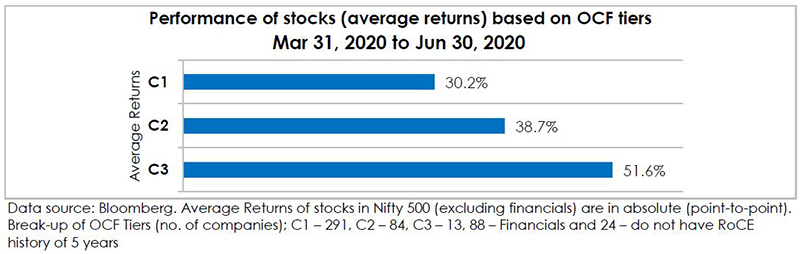
A similar pattern is visible in the market based on cash flow (OCF) parameters as well
Optimism that things can improve is replacing the pessimism of March 2020.
But to go back to the issue of pandemic proof investing. The first thing to remember is that the future cannot be predicted. But you can be prepared. The next crisis may be something else. Our ranking system for companies based on the twin pillars of RoCE and OCF are our best tool to judge the ability of companies to navigate a challenging period that we cannot predict. How we choose to allocate across these buckets, plays a role in the volatility experienced by the portfolios when crisis strikes. Of course, there is much more that goes into overall portfolio outcomes - individual stock selection, sector allocation and position sizes. And Valuations play a role. But that is a topic for another day.
Annexure:
1 year performance of stocks based on RoCE & OCF tiers: Pre-lockdown and Now